The Things You Should Know About OpenTelemetry Exemplars in .NET
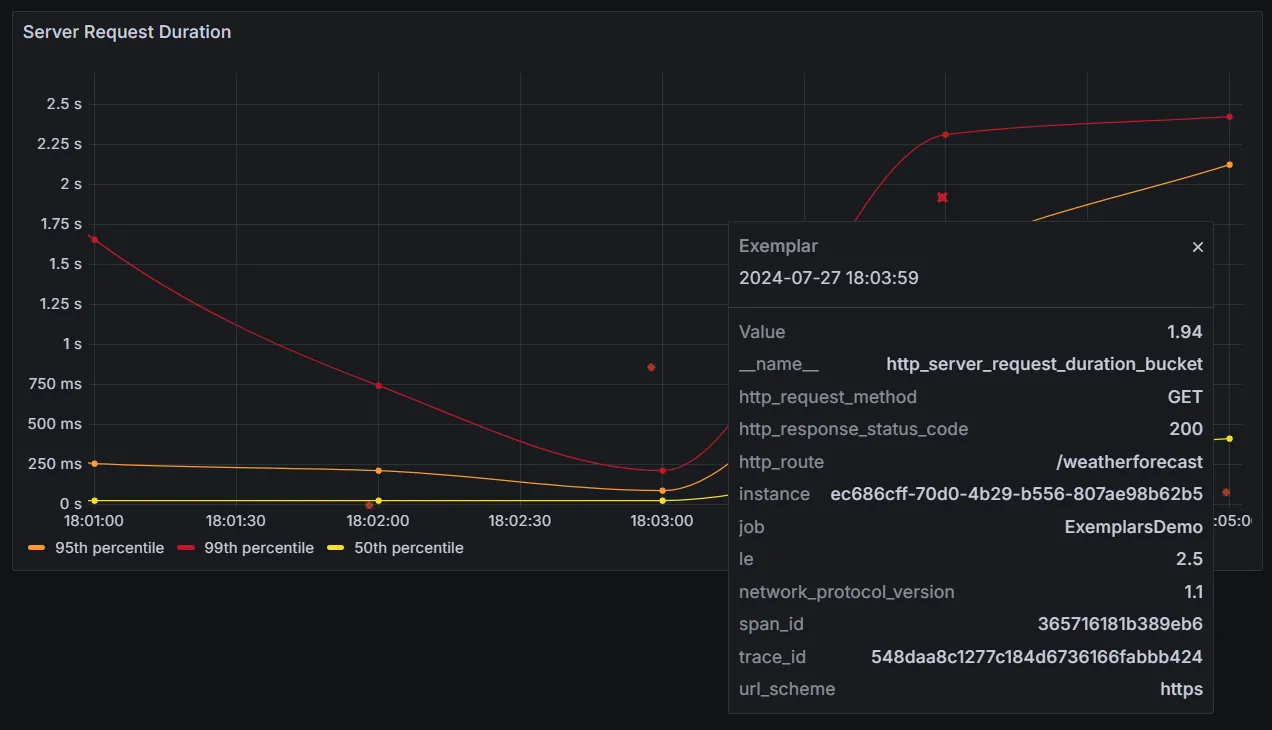
The goal of exemplars is to provide additional context to metrics. The idea is to pair the time series with a few raw measurements that contain extra information, such as which span was active at the time of the measurement. Thanks to that, when you see a peak in your request duration plot, you can quickly jump into the trace associated with the lengthy request.
The OpenTelemetry SDK for .NET introduced stable support for exemplars in version 1.9.0. I believe that exemplars are rather unknown to many .NET developers. So, this article aims to give you a brief overview of exemplars and highlight some important specifics you should be aware of. Let’s dive in and see if now is the right time to start using exemplars in your projects.
What Are Exemplars
Exemplars are sample data points that are associated with specific time series in your metrics. They capture the context of the specific measurements - when your application records a value of a metric. This allows you to correlate metric data with the trace that was active when the measurement was taken.
Each exemplar consists of:
- The raw value of the measurement, i.e. the value you put into
counter.Add()orhistogram.Record()and similar methods. - The time when the value was measured.
- The labels that were filtered out using a view (if any).
- The span id and trace id of the span which was active when the measurement was made.
How to Use Exemplars in .NET
There are two concepts you need to understand to start using exemplars in your project: the exemplar filter and exemplar reservoirs. These are the two stages of exemplar selection within your application.
Exemplar Filter
Exemplar filter is applied right after each measurement to decide whether it qualifies to become an exemplar. Simply put, if the filter says “no”, the extra context is immediately thrown away. Conversely, if the filter says “yes”, the exemplar is offered to a reservoir. The word “offered” is important here, as the reservoir ultimately decides what to do with the exemplar, which we’ll discuss shortly.
The filter is defined per the whole meter provider, so it basically decides whether you want to use exemplars at all. You can set it to one of the following values:
AlwaysOn- every measurement is eligible to become an exemplar.AlwaysOff- no measurement is eligible to become an exemplar.TraceBased- only measurements taken during sampled spans are eligible to become exemplars.
In .NET, the default value of the filter is AlwaysOff, even though the OpenTelemetry specification suggests TraceBased as the default.
The reason is the small but non-negligible performance cost.
Exemplars are arguably the most interesting for histograms.
If you really care about the performance of other instruments, you might want to enable exemplars only for
histograms.
You can configure the filter just for histograms via the
OTEL_DOTNET_EXPERIMENTAL_METRICS_EXEMPLAR_FILTER_HISTOGRAMS environment variable.
Exemplar Reservoir
The exemplar reservoir is the place where the exemplars are stored and collected for export.
Currently, there are two types of reservoirs available in the .NET SDK: SimpleFixedSizeExemplarReservoir and AlignedHistogramBucketExemplarReservoir.
The type of reservoir used is defined per metric.
However, a new instance of the reservoir is created for each specific
For histograms with explicitly defined buckets, the default reservoir is AlignedHistogramBucketExemplarReservoir.
This reservoir stores the last seen exemplar for each bucket of the histogram.
So when you define 10 buckets, you’ll get up to 10 exemplars per each unique set of labels.
For other types, the default is SimpleFixedSizeExemplarReservoir, which stores a predefined number of exemplars.
Each exemplar offered to this reservoir has the same probability of being stored.
Exponential histograms use this reservoir with the number of exemplars equal to the number of buckets up to 20.
All other instruments use this reservoir with the capacity of 1 exemplar.
Customizing the reservoirs or even configuring the existing ones for specific metrics is not yet a stable feature.
The reservoirs can be specified per metric via the View API as follows:
meterProviderBuilder.AddView(
    instrumentName: "my_counter",
    new MetricStreamConfiguration {
        ExemplarReservoirFactory = () => new SimpleFixedSizeExemplarReservoir(10)
    }
)
The only way to implement your own reservoir is by extending the FixedSizeExemplarReservoir class.
This class helps you with storing and collecting a fixed number of exemplars, while you can customize what should
happen with the offered exemplars.
The Setup
To enable exemplars, you only need to set the exemplar filter to AlwaysOn or TraceBased:
var builder = WebApplication.CreateBuilder(args);

builder.Services.AddOpenTelemetry()
    .ConfigureResource(resourceBuilder => resourceBuilder.AddService("ExemplarsDemo"))
    .WithMetrics(meterProviderBuilder => meterProviderBuilder
        .SetExemplarFilter(ExemplarFilterType.AlwaysOn)
    ).UseOtlpExporter();
Hm, but how can this work without setting up tracing? Even though exemplars are known for correlating metrics with traces, tracing is not a prerequisite. Recall that the tracing context is only one of the components of the exemplar. Even without tracing, you can still benefit from the other parts. But of course, the real power of exemplars comes when you use them in conjunction with tracing.
Sampling Makes It Complicated
It’s important to remember that exemplars do not contain the spans themselves. They only carry the IDs of the currently active span and trace. But what if this particular span is not sampled?
Head Sampling Works As Expected
Within TraceBased exemplar filter so that only the sampled spans are eligible to become exemplars.
This is nice as you are guaranteed to find the particular trace when inspecting the exemplar in your observability UI.
However, this also implies that you might lose the context of some unexpected values as they might not be measured during the sampled spans.
When You Want to Know the Context of Every Outlier
Imagine you’re handling a massive number of messages and use head sampling to record just a fraction of the operations. You use a histogram to track processing durations. Then you spot a few outliers in the histogram, hinting at a bug in the processing of specific messages. But you can’t see the context of these outliers in the traces, as they were not sampled. And all of that, even though you’ve set up exemplars. That can be annoying.
There is a way to exploit exemplars in this scenario as well.
If you don’t want to change your trace sampling strategy, you can utilize exemplars to get some extra context.
You can do so by extending the set of labels you record with some contextual information like message id.
Your metric backend would not be happy with these high-cardinality labels, so you’ll need to filter them out via
view API.
But remember, you’ll still get the filtered-out labels in the exemplars!
You just need to change the exemplar filter to AlwaysOn, so the exemplars can be recorded even when the current
span is not sampled.
Now, there is a high chance that the exemplar you examine would contain a not sampled span. You can solve this by writing a custom reservoir. The goal of this reservoir would be to record every exemplar until you get one with a sampled span. Thanks to that, when possible, you’ll get an exemplar with a sampled span. And, at minimum, you’ll always receive the extra labels.
As I’ve already mentioned, customizing the reservoirs is not yet a stable feature. Still, see the following gist to get the idea on how it could be implemented.
Tail Sampling Requires Some Extra Care
Unfortunately, the default implementation of exemplars basically breaks when you use
Thankfully, with just a little bit of work, this is solvable.
Once again, a custom reservoir is the solution.
This time, the only goal of the reservoir would be to use the first recorded measurement as an exemplar and add a special attribute (e.g. is_exemplar=true) to the active span.
Then, you’ll just need to configure the sampling algorithm to always sample the traces with this special attribute (see the documentation of OTEL collector tail sampling processor).
For the idea of the reservoir implementation, see this gist.
And a Few Other Things
It Works Only with the OTLP Exporter
Currently, the only way to use exemplars is via the OTLP exporter.
That is unfortunate for those of us, who use the good old Prometheus scraping.
Note, that the OpenMetrics text format (which can be scraped via Prometheus) supports exemplars.
Not All Observability Backends Support Exemplars
Before using exemplars, you should obviously check whether your observability provider supports them.
The most users of exemplars would probably be using Prometheus in combination with Grafana. Exemplars are opt-in in Prometheus, so you need to enable them via the appropriate feature flag.
The users of managed Prometheus services have it a bit more complicated.
You can’t use exemplars with the Azure Monitor managed service for Prometheus.
For local development or quick experiments, you should be able to use exemplars with .NET Aspire 8.1.0.
There Is A Slight Performance Cost
If you care about every nanosecond in your application, you should know that using exemplars comes with a slight performance cost.
Enabling exemplars will slow down the metrics recording by up to tens of percents.
With the current stable API, there is no way to enable/disable exemplars for specific instruments. Using the experimental API, you can opt out of exemplars by using a custom “noop” reservoir.
Exemplars Will Not Tell You Everything
I believe this point should be implied, but still. If you’ve never been deceived by the first look at your dashboard, you’ve probably had not solved enough incidents. Exemplars may be dangerous in a similar way. The feature is called exemplars, as they give you example data points. To get the full picture, you often need to dig deeper and query more thoroughly. That said, exemplars can be a great starting point for your investigation. They can guide you on which attributes or spans to focus on and so on.
Final Thoughts
As you’ve seen, exemplars can be a useful tool in your observability toolbox. However, the limitations such as the lack of support in the Prometheus exporter and the experimental status of reservoir customization might make them unsuitable for use in production environments. If this is not the case for you, I encourage you to give exemplars a try.